

What You Need to Know About CV
Category:
It is commonly understood that nearly every pneumatic device creates a flow restriction in the system. But… By how much? The measurement and expression of that flow restriction is not always as straightforward as it may seem. This article outlines the common methods that manufacturers utilize to express flow capacity.
In the pneumatic industry, CV (the coefficient of flow) is one standard for expressing the flow capacity of devices used in a pneumatic system. However, there are multiple other standards that also express flow capacity. Some common terms engineers might encounter include CV, C, effective orifice size, and normal liters per minute, as well as actual flow rates at specific pressure differentials. These terms are not interchangeable and even have slightly different meanings, interpretations, and formulas from one manufacturer to another. Therefore, it is important that engineers have a solid understanding of the data they are provided in order to prevent components from being oversized or undersized in pneumatic systems.
Measuring Flow with CV
Many manufacturers around the world have adopted CV as the standard value to express the flow capacity of their components. CV is based on the volume flow rate of water at 60°F through a device within one minute at a 1 psi differential (Fig. 1). However, there is a problem with using this equation in pneumatic applications.

Fig. 1: Basic calculation for CV, where Q is the rate of flow (gallons per minute), SG is the specific gravity of the fluid, and P is the pressure drop across the valve (psi).
Because air is compressible, CV must have additional factors built into the equations to compensate for that compressibility. For pneumatic applications, CV should be calculated by referencing the appropriate formula and conditions outlined in the ANSI/NFPA T3.21.3 specification. When doing so, it is important that proper test conditions are observed. This includes ensuring that the pressure upstream of the component being tested is a nominal 95 psia, and that the differential between the upstream and downstream pressure of the component being tested is 1 psi.
It is important to note that not every manufacturer expresses the flow capacity of their valves as CV based on the ANSI/NFPA specification. For example, below (Fig. 2) is the calculation used by one manufacturer. The constant in the equation accounts for the difference in the specific gravity of air versus the specific gravity of water. This calculation does not follow the pressure requirements of the ANSI/NFPA specification.

Fig. 2: Example of how one manufacturer deviates from the ANSI/NFPA standard with their CV calculation; where Q is the rate of flow (standard cubic feet per hour), ΔP is the pressure drop across the valve (psi), P1 is the inlet pressure (psia), P2 is the outlet pressure (psia), SG is the specific gravity of the fluid at standard atmospheric pressure (60°F and 14.7 psia), T is the absolute temperature Rankine (°F + 460).
While the CV method is the most popular standard, its accuracy relies on manufacturers adhering to the same test procedures. Some manufacturers test and publish CV without any explanation of how they produce it, while others publish explanations but fail to follow the ANSI/NFPA T3.21.3 standard. Because CV only looks at a 1 psi differential, the calculated flow at low pressures can be very accurate, but certain applications that have higher differentials can produce flows that do not match the calculated results. It is important to be aware that misinterpreting the CV value can lead to differences in ratings of over 20%.
Using Sonic Conductance as a Measure of Flow
In place of CV, some manufacturers choose to publish C, the sonic conductance of a pneumatic component. This is defined by ISO 6358 and focuses on the sonic conductance of the component and the critical pressure ratio. The sonic flow condition of a valve is when it has reached the maximum possible flow. Increasing the pressure once sonic flow has been reached no longer increases flow. This condition is also known as choked flow. The critical pressure ratio is the ratio between downstream pressure and upstream pressure when the component has reached the maximum flow condition.
Many manufacturers argue that subsonic flow data (C) is more reliable than CV because it is based on the maximum flow through a valve. With the C number plugged into an equation it is possible to calculate a flow rate for any pressure differential. However, some confuse C value with CV, which can lead to confusion and incorrectly sized components.
The Benefits of Using Effective Orifice to Measure of Flow
The effective orifice size of a valve is relatively straight forward. This data corresponds to actual flow rates that would be achieved by simply putting an orifice in line. It is also known as the effective sectional area (the area of the effective orifice) and is related to the sonic conductance as the effective flow orifice is generally determined by empirically testing for the choked flow condition.
The effective orifice method can have benefits since the flow can be expressed in one number that is easy to understand. There are many charts available which show similar CV's and flow rates for orifice sizes, but there is not an industry standard on testing valves to achieve an effective orifice. Some flow calculations use orifice sizes, so having the effective orifice size of a valve can reduce conversions and extra calculations in certain applications. While this method is great for general flow conditions, it can also be confusing since some manufacturers publish an orifice size which is not an effective orifice. Factors such as turbulence or poppet stroke of the valve make the actual valve orifice flow very different from the effective orifice flow.
How to Use Normal Liters per Minute (Nl/min) to Measure Flow
Outside of the United States, it is common for pneumatic components to be published with a flow rate in normal liters per minute (Nl/min). Nl/min is a flow rating at a specific pressure with a 1 atm differential between the upstream pressure and the pressure downstream from the component. The flow is then converted to "normal conditions," which are not always the same. Some commonly used "normal" conditions include:
- Temperature at 0°C, pressure at 1 atm, 0% relative humidity
- Temperature at 20°C, pressure at 1 atm, 0% relative humidity
- Temperature at 21°C, pressure at 1 atm, 0% relative humidity
- Temperature at 0°C, pressure at 1 bar, 0% relative humidity
While these variances have minimal effect on flow ratings, the absence of a published standard for the "normal condition" creates some confusion in the industry. The normalized liter per minute method can be confusing since it takes the actual flow rate at a pressure differential and converts it to a flow rate at "standard conditions." Different manufacturers have different "standard conditions," but most publish Nl/min at a 1 atm differential. The 1 atm differential may be with 6 atm on the inlet and 5 atm on the outlet to achieve the 1 atm differential. This is important because that differential of 1 atm is not the same flow rate as 1 atm on the inlet of a valve and the exhaust to atmosphere. Flow rates between Nl/min and l/min to atmosphere can be vastly different. The Nl/min generally requires the engineer to calculate the flow rate back to the "standard conditions."
Using Actual Flow to Express Flow Capacity
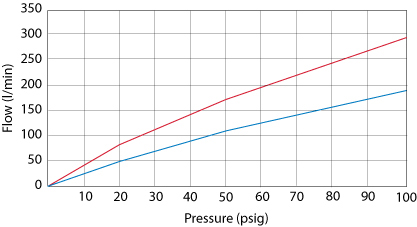
Fig. 3: Example of a pressure vs. flow chart
Some manufacturers simply provide the actual flow the valve achieved at a specific pressure differential. This flow rate is often published for the maximum pressure rating of the valve and therefore expresses the maximum flow rate for that component. Other manufacturers take this a step further and publish flow charts that express the valve performance over the entire pressure range of the component.
Some manufacturers provide a flow chart with this data to show how the flow rate changes as the pressure differential to atmosphere changes. For example, at right (Fig. 3) Clippard lists the flow characteristics of their valves as a flow rate at a given pressure differential and provides a chart for the flow rate as the pressure differential changes. This makes it easy for engineers to determine the flow rate at a specific pressure and greatly reduces the possibility for confusion on the data. However, there is no industry standard for testing the actual flow rate of pneumatic components.
An Overview of the Pros & Cons of Different Flow Measurements
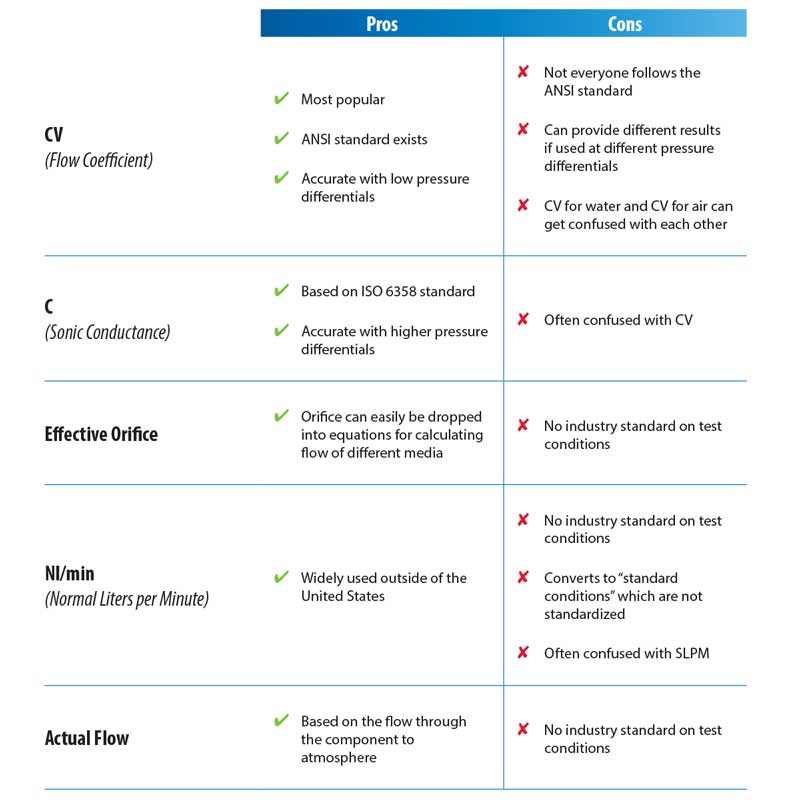
There are many methods in which the flow capacity of a component can be represented. The variety of methods that manufacturers use to express flow can vary from manufacturer to manufacturer as well as from one country to another which can seem overwhelming. However, with a basic understanding of the most popular methods, engineers can apply them properly in pneumatic systems to ensure properly sized components. Still have questions? Contact Clippard or your local Clippard distributor for assistance.
Download White Paper: Methods of Rating Flow 
By Mike Kettering • Technical Sales Specialist • Clippard
Related Content
- Air Flow Calculator
- Orifice Size Calculator
- Pneumatic Solutions for Digital Mass Flow Controls
- Glossary of Pneumatic Terms


